A smart e-paper display
25 September 2025A picture is worth a thousand words, so here is the finished product:
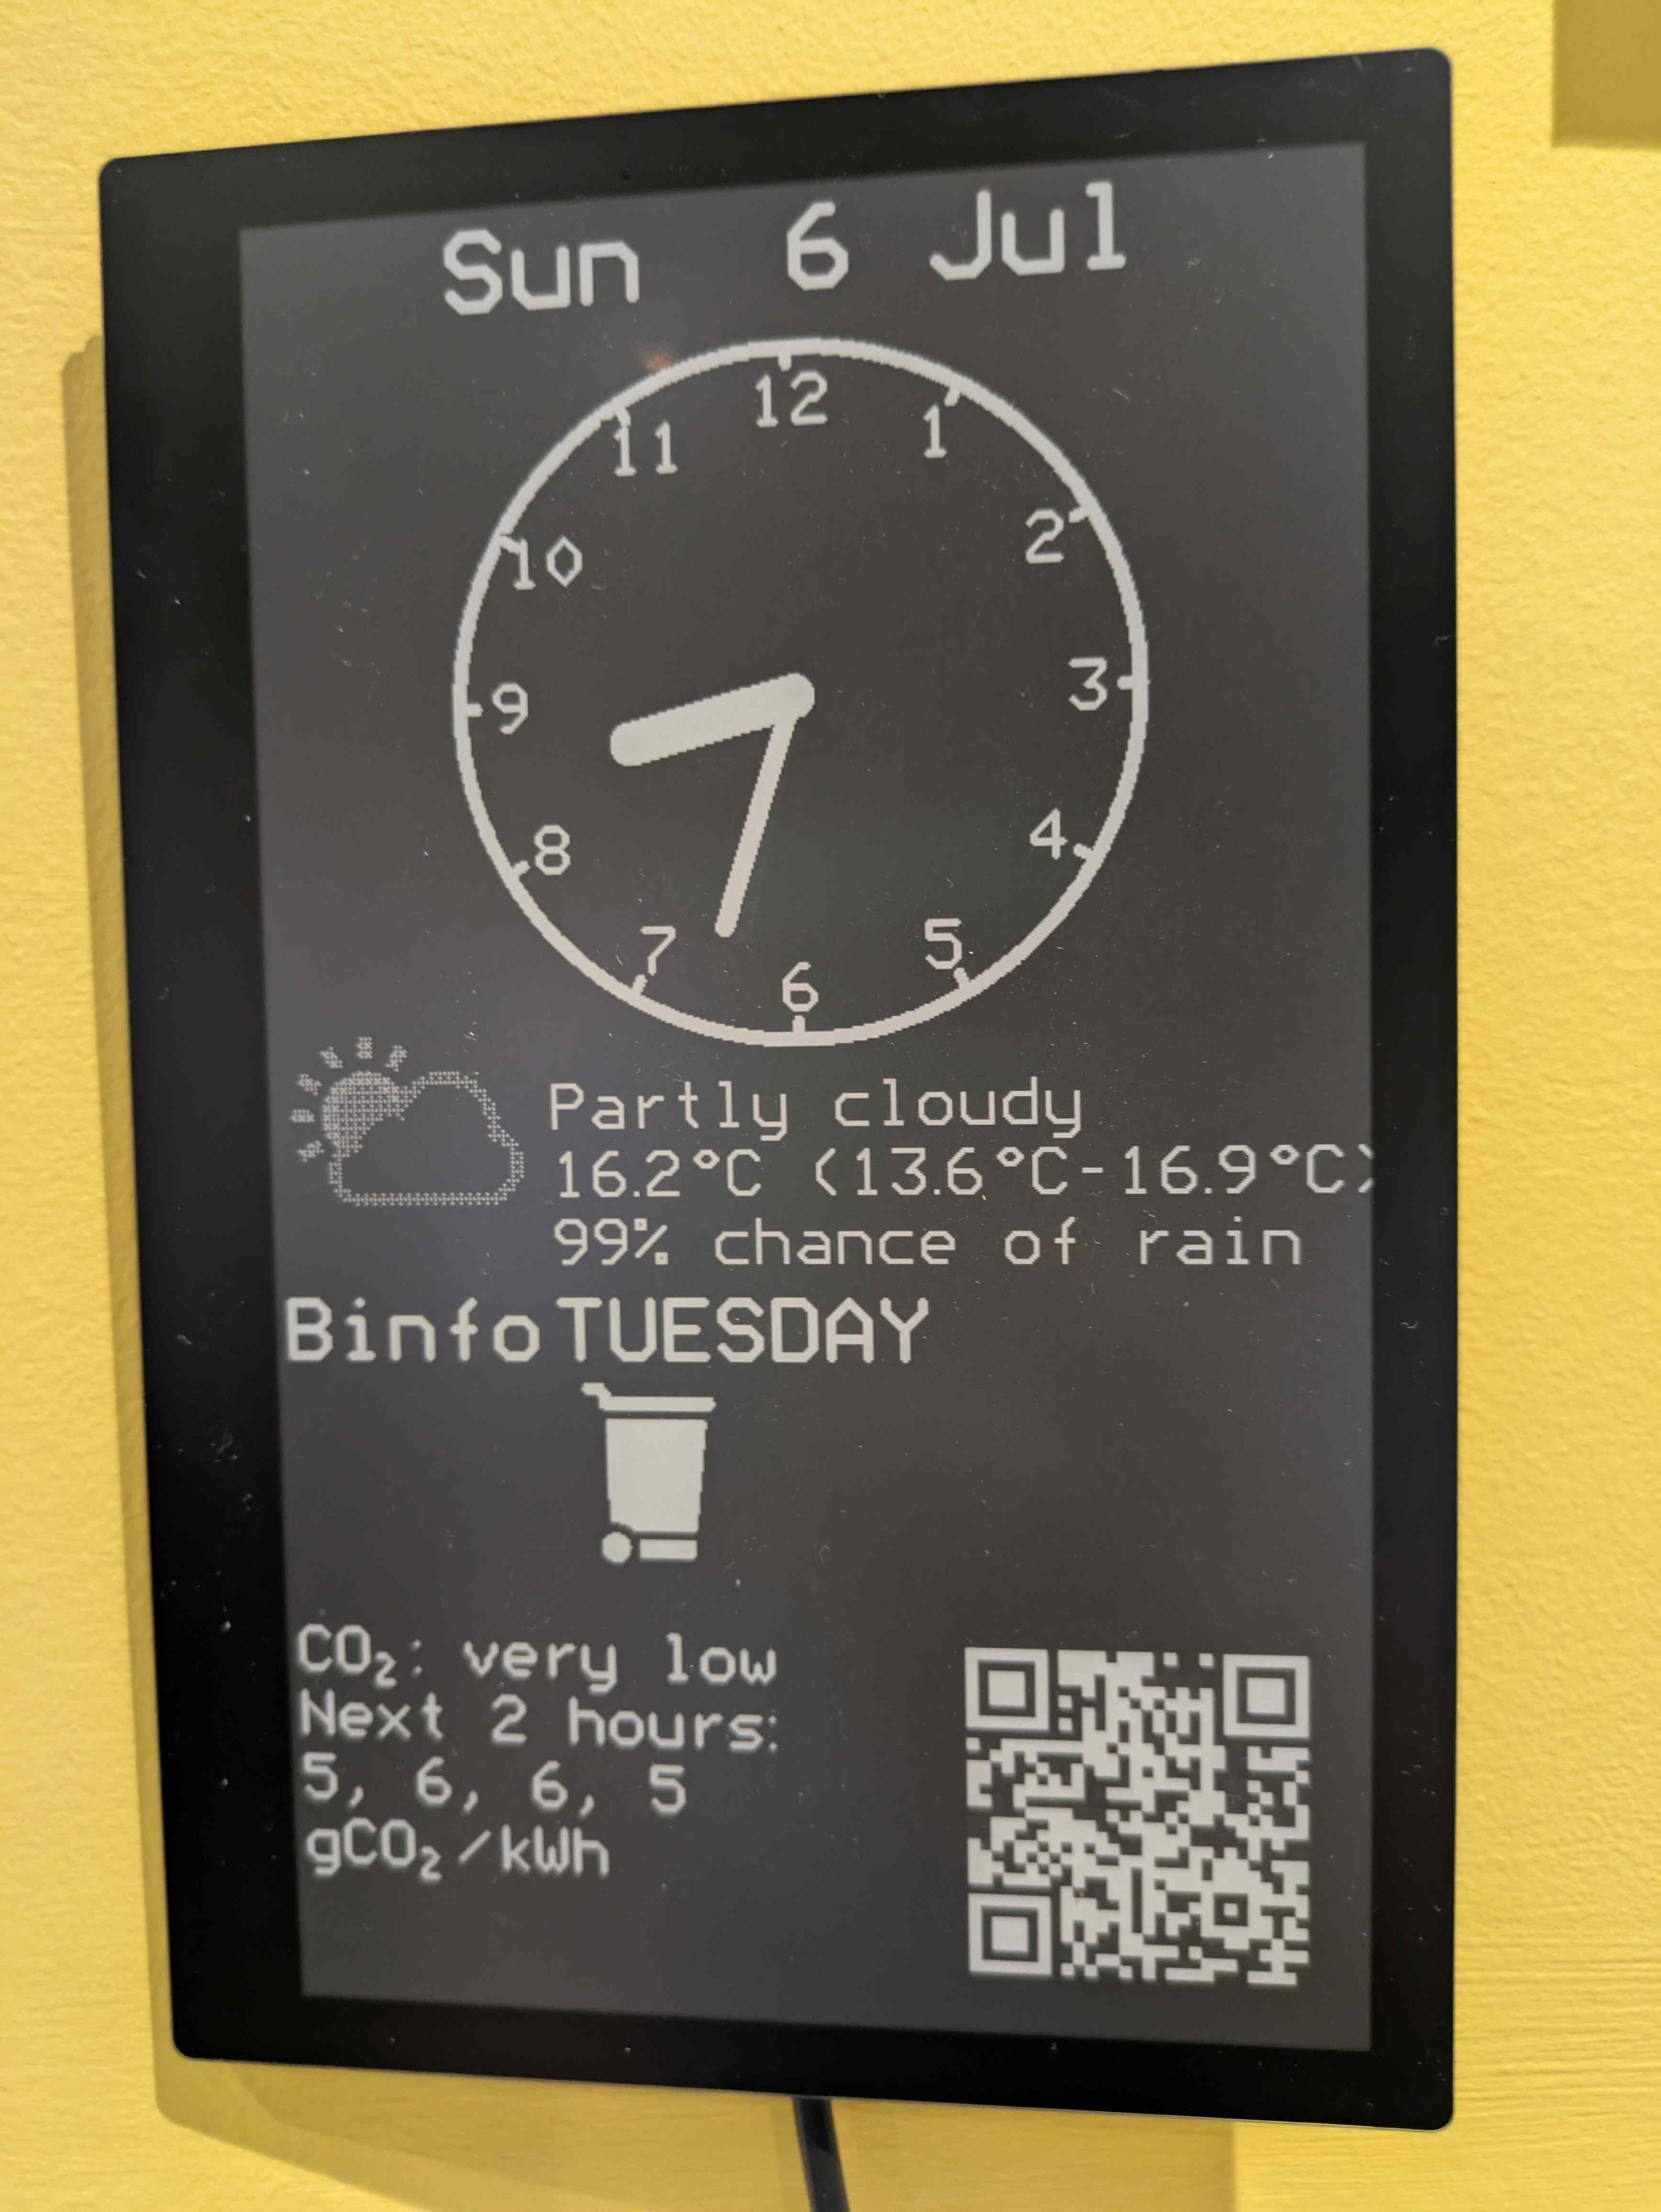
This is an e-paper display, made by RevK, and sold on Tindie, which I have set up to show some useful stuff in my kitchen. To the extent that this post is a review, it’s a positive one: the display itself is of great quality, and the software running on the controller, while a little tricky to get to grips with, is flexible enough to serve all of my needs, with a fun side project to build along the way.
This project started when my partner asked whether I could put something together that would use the UK grid operator’s Carbon Intensity API to notify us (or her) when the grid was operating at its cleanest so we know when to run the washing machine or dishwasher. I spent a bit of time trying to figure out the Web Push API but never really got anywhere with it, and it got shelved until I saw various posts from RevK’s Mastodon about the e-paper devices he’d been working on and I decided that would be a fun way to show the data. I also thought it’d be useful to show the upcoming bin collections on it too, especially as I saw there was a built-in module to do that in the controller (but more on that later).
So $160 and 1 working day’s delivery later, I had the screen in my hands. The set-up experience was pretty smooth: once power is supplied by USB-C, the device hosts a WiFi network for you to connect to and then all configuration is done via a web interface it provides.
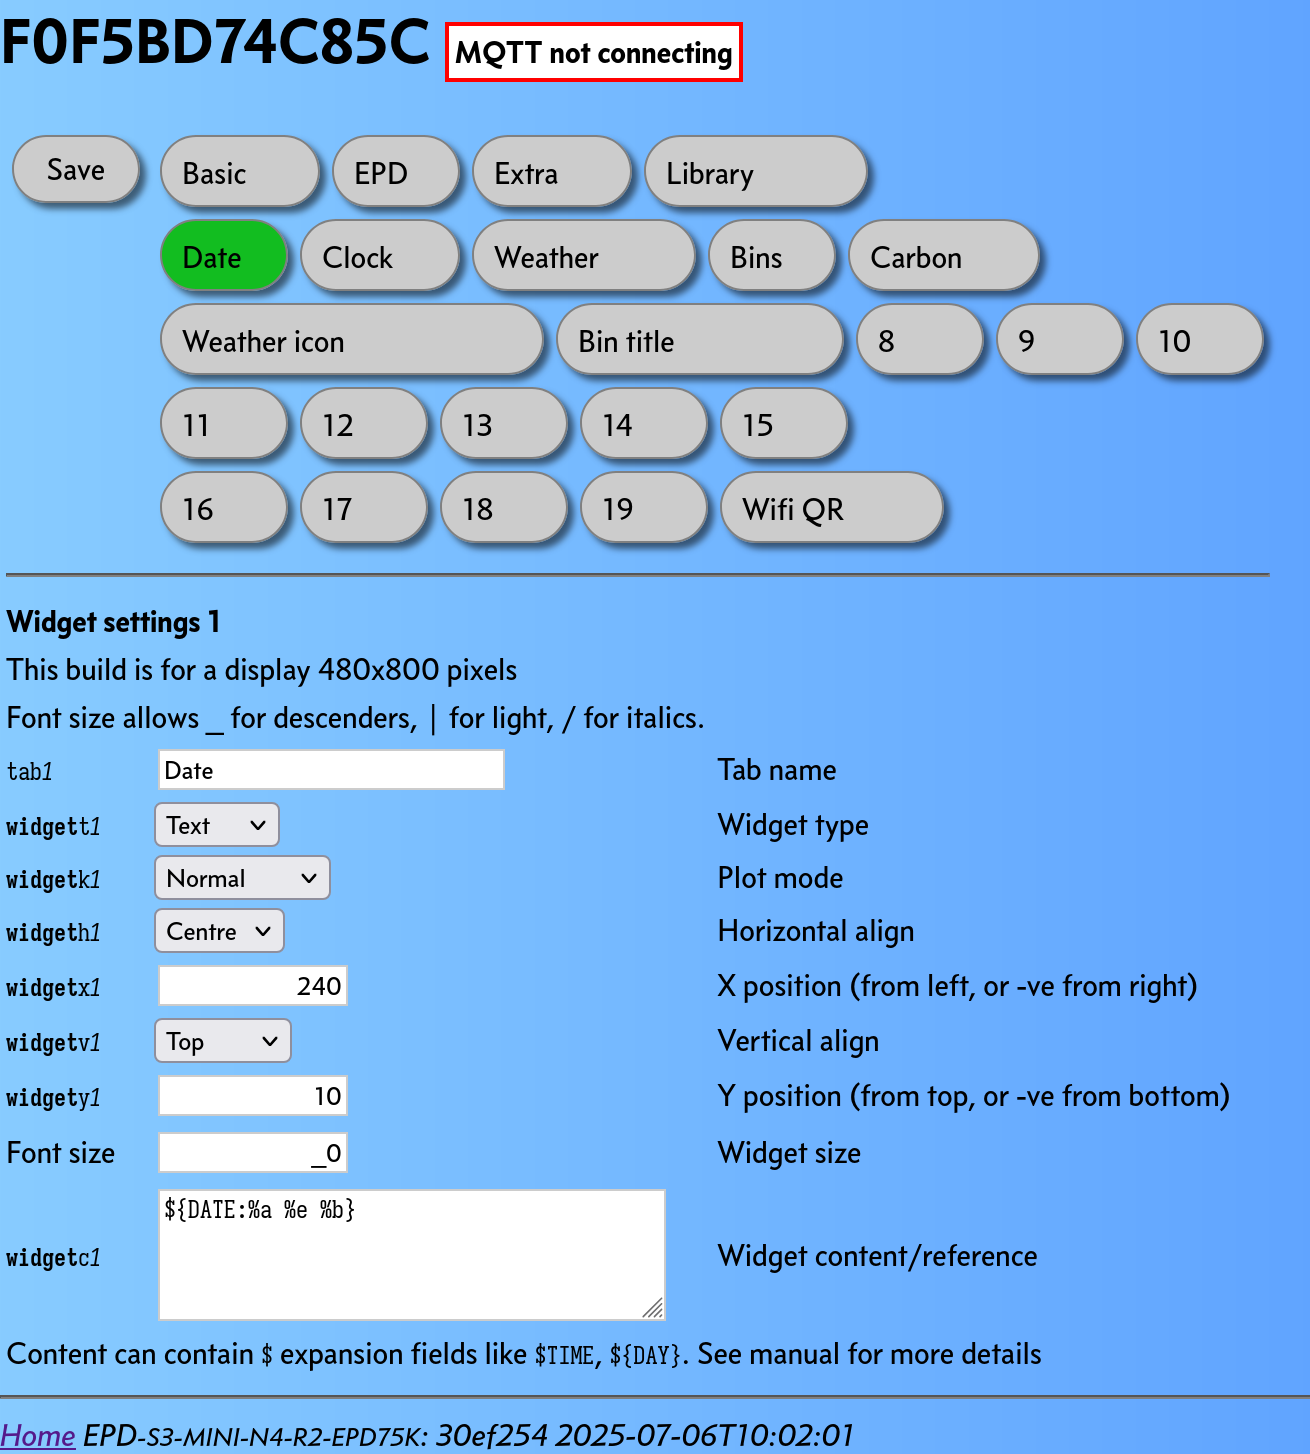
The web interface takes a bit of getting used to, and a lot of reference to the docs to figure out which substitution variables and size parameters go where, but eventually I had things laid out and looking like I wanted them to.
The next step was putting together a service1 to bridge between the display and the Carbon Intensity API and council bin services so that it could display them. This amounts to providing some JSON endpoints which provide the necessary data. For the bins display, there’s a schema in the docs, but the carbon intensity display uses the $API substitution variable so that is up to me.
I wrote this service using Elixir’s Phoenix framework, and the source is available here. It’s nothing too complicated, but it’s the first “production” service I’ve built in Elixir. I reimplemented the logic for scraping Lancaster City Council from the excellent UKBinCollectionData repo. There’s also some caching so it doesn’t re-fetch the same info on every call to the endpoint when the bin collection dates aren’t going to change very often.
And it all works beautifully! I included a NixOS module in the flake for the service, so it was easy to deploy it to the Raspberry Pi sitting next to my WiFi router, and it’s been sitting there doing the job for a couple of months now.
I named it “thyra” from the Ancient Greek “θύρα” meaning “door”, i.e. “portal”.↩︎